
Robert W. Yokl, Vice President/COO, SVAH Solutions
Revelations Eight Years Out from Our Publishing of “Healthcare Supply Utilization Revolution – The Future of Supply Chain Expense Management”
Eight years ago, we self-published and distributed our free book, Healthcare Supply Utilization Revolution – The Future of Supply Chain Expense Management, and distributed over 2,300 copies throughout our supply chain industry. It was very popular, and we continue to receive requests for the book from time to time. Why did we write this book in the first place when at the time we were predominantly viewed as value analysis experts in the healthcare industry?
Why Would Value Analysis Experts Write About a Totally New Concept?
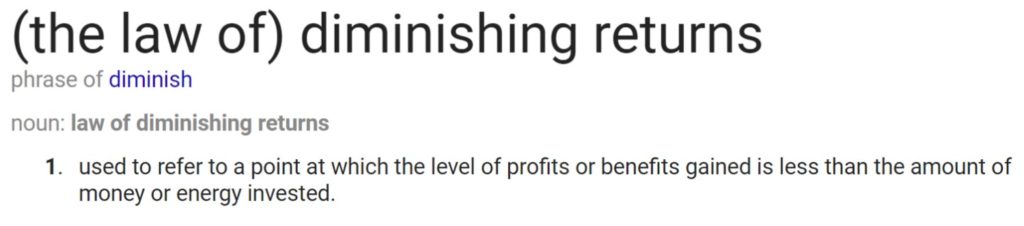
In working with our hospital and health system clients, we saw that our industry’s primary strategy of Group Purchasing and Custom Contracting was starting to suffer from what we called, “The Law of Diminishing Returns.”
We were measuring the amount of overall price savings that hospitals accomplished year by year and dividing it into overall spend on contract. Astonishingly, we found that hospitals and health systems were only netting about 1% to 3% in overall savings. That was hard to believe back then, and I think it is still hard to believe today that with all of the hundreds of thousands, and in many cases, millions of dollars that are saved throughout the year, the net results are only 1% to 3% of overall savings. That isn’t enough to cover the cost of inflation most years, let alone the amount of new products that have been deployed.
Fast Forward to 2018
Let’s fast forward when a prospective client had told me that one of their main strategies for savings for 2018 was to join a cooperative group that was backed by their national GPO. Curious about this, I went to the regional GPO’s website and found their annual report where they stated that they saved over $100 million for their members and had billions under contract. The calculation was simple, and we divided the savings into the spend under contract and found that they were only saving 1.4% overall for their members. If you backed off the dollars for rebates, they were only saving 1% overall for their customers in contract-related price savings. This is the price model of the future, and what we see in the maturity of these organizations is barely 1% overall savings or only about $550K per year per member hospital — now that is eye opening. If you had any doubt that price savings are dramatically diminishing, here is the proof on a national and regional scale.
Ignore These Facts at Your Own Supply Chain Organization’s Peril
This particular regional extension of a national GPO has been around for many years. This tells me that they have a high level of maturity and compliance which is the model that is being espoused as the next level of big savings over the past 8-10 years. Some newer, some older, but most are national GPO based and extending the savings with customized contracting for their regions. By the way, I am not a disbeliever in these regional cooperatives. As a matter of fact, I believe that every healthcare organization should belong to regional cooperatives. My regional GPO clients take advantage of not only price and volume-based savings but also employ a strong value-based supply utilization system for their hospitals to gain the highest level of savings at the 7% to 18% levels.
Why wouldn’t we want to have the best of both worlds of price savings and utilization? Clearly, the evidence is before us, as we were seeing in 2009 we are now seeing played out right before our eyes. With even the most mature models of price and standardization savings, we are only seeing an overall return of 1% to 2%. We have to start moving towards the next big savings opportunities for our healthcare organizations.
5% to 15% in 2009 is Now 7% to 18% Savings from Supply Utilization in 2018 and Beyond!
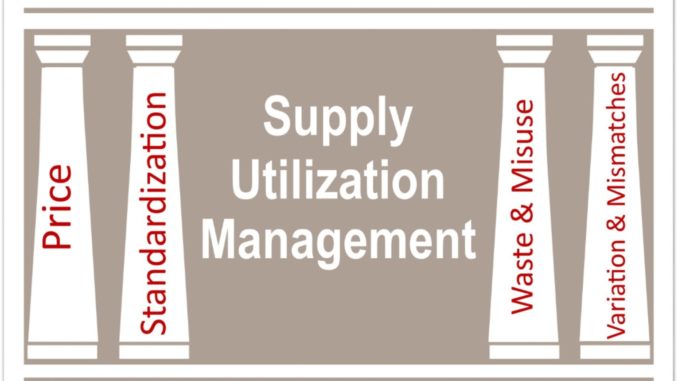
Our tracking of supply utilization for our customers back in 2009 (and published in our book) was 5% to 15% of overall supply chain budget in supply utilization savings. Supply utilization savings has climbed higher in 2018 to 7% to 18% while price savings has diminished to 1% to 2%. If you compare that to what price savings was netting for, say, a 250-bed hospital who had about $108 million in annual supply spend, that would give you $1.1 million in price savings versus $7.6 million or 7% in supply utilization savings ($19 million savings at the high end of 18%). With price savings topping out, you must now start shifting your focus to Supply Utilization Management which includes price, standardization, product mismatches, waste, and inefficient use of products. Yes it is about the overall cost of ownership of these products that is most talked about and by tracking utilization you can now cover this most important base too!
Let’s face the facts, our supply chain efforts have been ever maturing but mostly focused on getting better prices and standardization. However, as detailed above, where do we get our next big savings after we start experiencing “The Top Out Effect?” We could choose to go further down the road of price savings, bidding out the GPO we belong to, joining even more regional cooperatives, or we can realize that the evidence is clear that we are sitting on a gold mine of supply chain savings in supply utilization management. Using the mining terminology, we have exhausted the mine shafts of price and standardization and have cashed in all we could, but now we must start mining the pristine shafts that contain supply utilization savings opportunities. As we illustrate in the graphic above, we have only been focusing on 50% of the supply chain pillars of savings opportunity and are leaving the other 50% untouched.
What Do We Do Once We Recognize that Supply Utilization is the Way to Go Now?
The good news is that you don’t have to give up any of your efforts that you have in place with your GPOs or your price or contract strategy. These are pillars of your success and must remain in place. What you need to now focus on is having the ability to track 100% of your supply chain to know exactly where your next savings opportunities are residing. This means better systems that are focused on Supply Utilization Management which means hospital volume centric measures compared to supply chain spend. Think, what is my cost per metric in ablation to pacemakers to wound care and everything in-between on an ongoing basis? You will be amazed by what this will tell you about your supply chain costs.
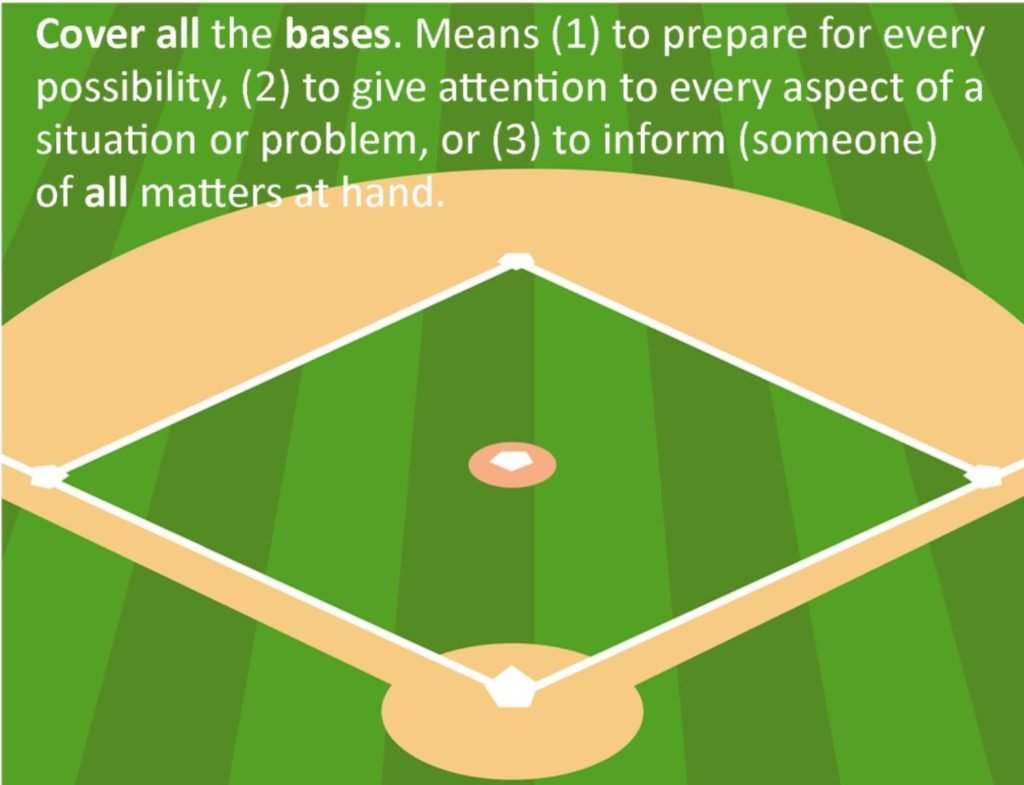
Isn’t It About Time that We Cover All Our Bases in Our Supply Chain Organizations?
The best evidence in the fight to reduce supply chain costs on a wholesale level is utilizing your own data to its fullest in the form of a supply utilization system that tracks all costs per volume metric on an ongoing basis, so you can be alerted to savings opportunities at every level. Plus, you can strategize on how you want to attack these savings once they show true opportunity is at hand (VA, standardization, evidence based research, etc.). With mergers and growing health systems around the country, a solid supply utilization management system will help you better focus your attention on the hospitals that are your worst performers and also focus on the strengths and best practices of your best performing hospitals.
Don’t Underestimate the Power to Know with Supply Utilization Management
Your opportunities are endless once you start down the road of supply utilization management. The best part is that you can finally see the results of your changes and the exact impact they have on your supply chain costs over the short and long term. The ultimate sustainable supply chain resides with the power to know!


